之前接触Jpgraph时想做一下网上展示的小例子,但在琢磨透别人的做法后,总想用自己的方式做一下。借此可以巩固一下基础,锻炼一下自己的思维。
本例并没有使用Ajax实现无刷新般的显示投票结果。在Echarts实现时再考虑Ajax的使用,学习要讲求循序渐进,工作也是。
步:建立简单的前端页面,很简单的。大佬要是看见了,别喷啊。我是小菜。暂不考虑代码分离问题,其实也简单。
-
php
-
header("content-type:text/html;charset=utf-8"); //设置网页字符集
-
//连接MySQL服务器选择数据库并设定字符集
-
if(!mysql_connect("localhost".":"."3306","root","root"))
-
{
-
die("MYSQL服务器连接失败!");
-
}
-
if(!mysql_select_db("online007"))
-
{ die("online007数据库连接失败");}
-
-
mysql_query("set names utf8");
-
//判断前台是否提交
-
if(isset($_GET['ac'])&&$_GET['ac']=='ac')
-
{ //在前台有投票动作时获取选定参选人对应的id以更新数据库里参选人的计票数
-
$id=$_GET['vote'];
-
$sql="update vote set count=count+1 where electorid={$id}";
-
if(mysql_query($sql))
-
{
-
$str="您的投票成功计数,感谢您的参与。";
-
header("refresh:2;url=vote.php");
-
}
-
else
-
{
-
$str= "系统故障,投票未成功!";
-
}
-
}
-
else
-
{
-
$str="";}
-
-
?>
-
>
-
<html lang="en">
-
<head>
-
<meta charset="UTF-8">
-
<title>参选投票title>
-
<script>
-
window.onload=function(){
-
var obj=document.getElementById("view");
-
obj.onclick=function()
-
{location.href="votecount.php";}
-
}
-
script>
-
head>
-
<body>
-
<fieldset>
-
<legend>请投下您宝贵的一票legend>
-
<form action="" method="get">
-
<input type="radio" name="vote" value="1" checked>小布什
-
<input type="radio" name="vote" value="2">奥巴马
-
<input type="submit" value="投票">
-
<input type="hidden" name="ac" value="ac">
-
<input type="button" id="view" value="查看当前结果">
-
<label>php echo $str ?>label>
-
form>
-
fieldset>
-
body>
-
html>
前台页面效果:
未投票前:

投票成功:

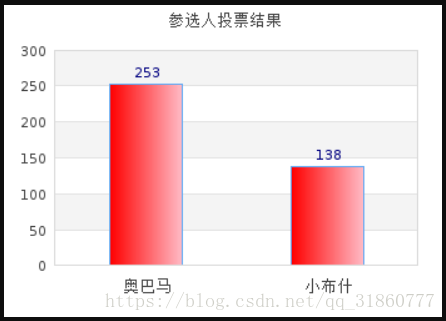
第二步:当单击“查看当前结果”时,在另一页面显示图片,图片由jpgraph根据数据库相关信息生成。
-
-
header("content-type:text/html;charset=utf-8");
-
require_once ('../jpgraph/Examples/jpgraph/jpgraph.php');
-
require_once ('../jpgraph/Examples/jpgraph/jpgraph_bar.php');
-
-
-
-
if(!@mysql_connect("localhost".":"."3306","root","root"))
-
{
-
die("MYSQL服务器连接失败!");
-
}
-
if(!@mysql_select_db("online007"))
-
{die("online007数据库连接失败");}
-
mysql_query("set names utf8");
-
-
$sql="select name,count from vote group by name";
-
$result=mysql_query($sql);
-
-
$arr1=array();
-
$arr2=array();
-
while($arr=mysql_fetch_assoc($result))
-
{$arr1[]=$arr['name'];
-
$arr2[]=$arr['count'];}
-
-
-
$graph = new Graph(350,250);
-
$graph->SetScale('textlin');
-
$graph->SetMarginColor('silver');
-
-
$graph->title->Set('参选人投票结果');
-
-
-
$bplot = new BarPlot($arr2);
-
$bplot->SetFillGradient('red','pink',GRAD_VERT);
-
$bplot->SetColor('darkred');
-
-
-
$graph->xaxis->SetTickLabels($arr1);
-
$graph->title->SetFont(FF_SIMSUN);
-
$graph->xaxis->SetFont(FF_SIMSUN);
-
-
$graph->Add($bplot);
-
$bplot->value->Show();
-
$bplot->value->SetFormat("%d");
-
$graph->Stroke();
-
?>
显示投票结果图片:
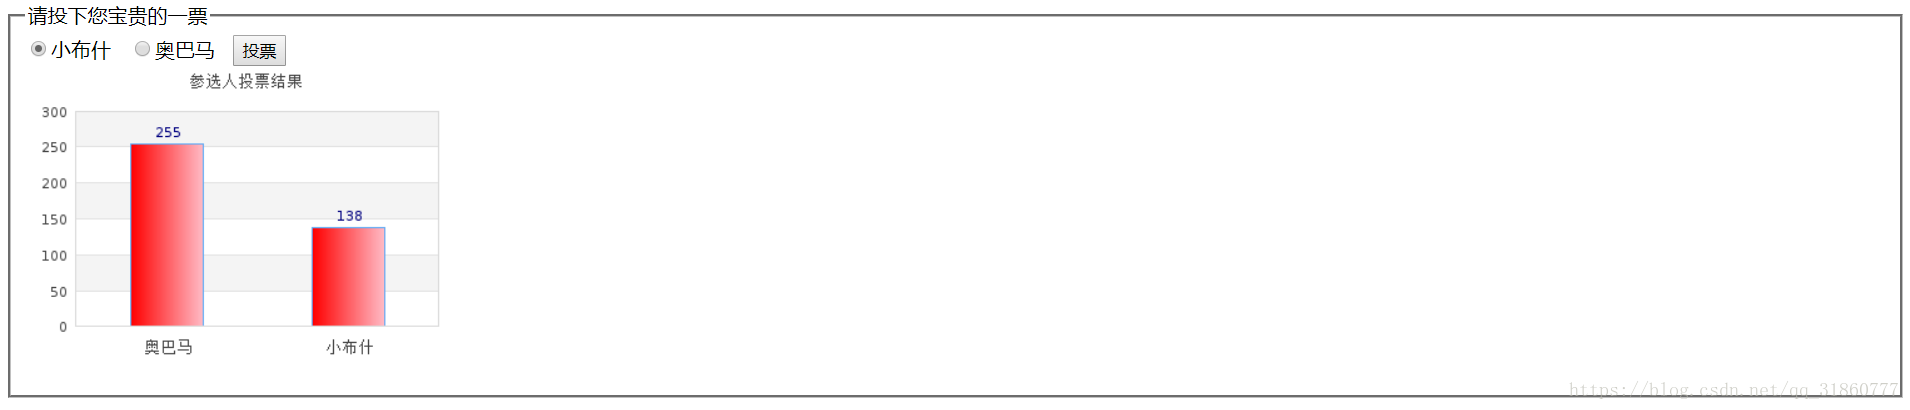
另注另一种做法:当然可以把投票结果图片用img标签(src属性可以是PHP文件名)直接显示到投票页面,因为没有使用ajax实现无刷新展示,所以点击投票后页面会有刷新时的抖动。
效果展示:
本站文章版权归原作者及原出处所有 。内容为作者个人观点, 并不代表本站赞同其观点和对其真实性负责,本站只提供参考并不构成任何投资及应用建议。本站是一个个人学习交流的平台,网站上部分文章为转载,并不用于任何商业目的,我们已经尽可能的对作者和来源进行了通告,但是能力有限或疏忽,造成漏登,请及时联系我们,我们将根据著作权人的要求,立即更正或者删除有关内容。本站拥有对此声明的最终解释权。